
Stack Overflow (SO) is a well-known website for all things related to code. Whether you’re a newbie or a seasoned developer, chances are you’ve spent some quality time scrambling around people’s Q&As for insight on how to unstuck you on your code.
In their words:
Founded in 2008, Stack Overflow is the largest, most trusted online community for anyone that codes to learn, share their knowledge, and build their careers. More than 50 million unique visitors come to Stack Overflow each month to help solve coding problems, develop new skills, and find job opportunities.
Another great thing about SO is the Stack Overflow Annual Developer Survey. Every year since 2011, they open the survey to anyone willing to commit their time to it. In addition to SO’s insights, this data collected makes it possible for anyone else to get ideas about the community, its members and people that contribute to the website.
After a little while of constantly visiting SO as I was learning new languages, features, ways to visualize data, I started wondering about women involved with tech. The data collected by the Annual Developer Survey from 2019 is a good start to get some insights.
This article comprises some analysis about
Table of Contents
You can find the repo with the code related to this article here.
The survey and questions asked are available in the next pdf:
Gender
The most obvious yet dumb question we could ask ourselves is if women use Stack Overflow.
And, yes! We do use it. But, let’s lean on the data.
| % of respondants | |
|---|---|
| Man | 91.23 |
| Woman | 7.42 |
| Non-binary | 1.33 |
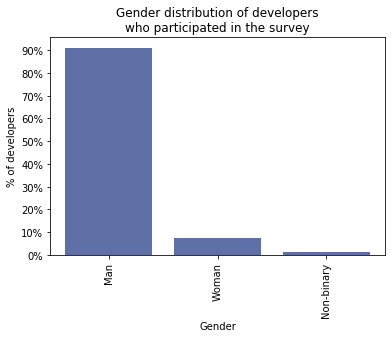
The survey had 88883 participants. Approximately 91.2% of the participants were men, 7.4% were women, and 1.3% as non-binary, genderqueer, or gender non-conforming.
The survey had 6344 of 88883 participants that identified themselves as women (7.1%), and 3477 (3.9%) that didn’t provide information.
This analysis will focus on participants of the survey whose gender identity (or one of them) was woman.
Employment
When asked about their employment status at the time of the survey. 112 out of the 6344 women developers who participated didn’t provide information.
The answers provided by the rest of them, led to the next insights:
| % of women | |
|---|---|
| Employed full-time | 73.82 |
| Not employed, but looking for work | 8.27 |
| Employed part-time | 6.72 |
| Independent contractor, freelancer, or self-employed | 6.67 |
| Not employed, and not looking for work | 4.13 |
| Retired | 0.35 |
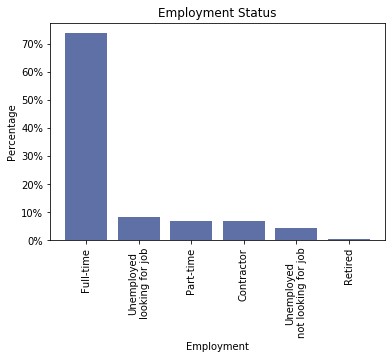
Approximately 73.8% were employed full-time, 8.3% were not employed, but looking for work, and 6.7% were employed part-time.
5436 out of 6344 women developers (85.7% of them) were actively working at the moment of participating in the survey.
What about their job? Were they developers?
In this context, we understand developer as someone who writes code. Not more, nor less.
Work as Developers
When asked how did they identify themselves in terms of developer, they could provide only one of the pre-established answers, or none.
| % of women | |
|---|---|
| I am a developer by profession | 78.00 |
| I am not primarily a developer, but I write code sometimes as part of my work | 11.75 |
| I am a student who is learning to code | 6.70 |
| I used to be a developer by profession, but no longer am | 1.94 |
| I code primarily as a hobby | 1.59 |
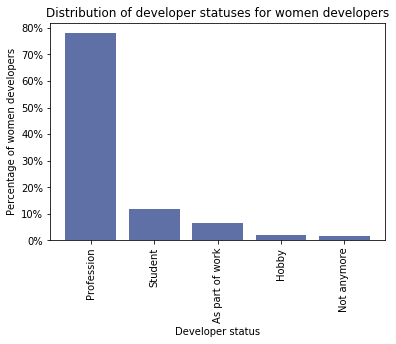
From the 5436 women developers actively working at the time of the survey, 552 didn’t provide information on this question.
From those 4884 women who did, approximately 78.0% answered they are developers by profession, 11.8% said they were not developers, but write code sometimes as part of their work, and 6.7% were students learning to code.
Formal Education
In general, another talking point is if you need some kind of formal education to get a job in tech.
| % of women | |
|---|---|
| Bachelor’s degree (BA, BS, B.Eng., etc.) | 54.36 |
| Master’s degree (MA, MS, M.Eng., MBA, etc.) | 27.20 |
| Some college/university study without earning a degree | 7.64 |
| Other doctoral degree (Ph.D, Ed.D., etc.) | 3.31 |
| Associate degree | 2.95 |
| Secondary school | 2.68 |
| Professional degree (JD, MD, etc.) | 1.17 |
| I never completed any formal education | 0.44 |
| Primary/elementary school | 0.20 |
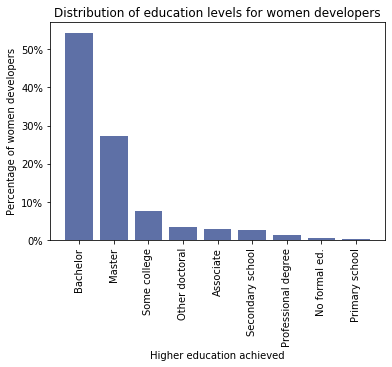
From the 4848 women developers, actively working as developers at the time of the survey, 84 didn’t provide information on their education, approximately 54.4% had a Bachelor’s degree (BA, BS, B.Eng., etc.), 27.2% a Master’s degree (MA, MS, M.Eng., MBA, etc.), and 7.6% had some college or university level courses but didn’t earn a degree.
Country
Where were these women located at the time of the survey?
| Top 20 Countries | % of women |
|---|---|
| United States | 34.75 |
| India | 8.62 |
| United Kingdom | 7.32 |
| Canada | 4.84 |
| Germany | 4.74 |
| Australia | 1.95 |
| France | 1.91 |
| Poland | 1.85 |
| Netherlands | 1.75 |
| Brazil | 1.56 |
| Israel | 1.50 |
| Russian Federation | 1.42 |
| Romania | 1.38 |
| Spain | 1.29 |
| Bulgaria | 1.19 |
| Sweden | 1.15 |
| Ukraine | 1.05 |
| Italy | 0.80 |
| Serbia | 0.76 |
| South Africa | 0.72 |
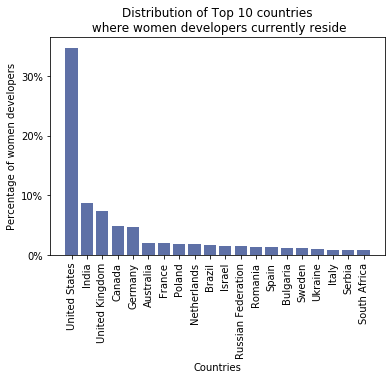
The 4848 women developers actively working at the time of the survey and provided information about their education, were predominantly from United States (34.8%), India (8.6%), United Kingdom (7.3%), Canada (4.8%), and Germany (4.7%).
Ethnicity
Tech-industry diversity is improving, but it’s still pretty terrible. Women, black, and Latinx representation is particularly poor.
— The Problem With Diversity in Computing
For this question, was possible to mark more than one answer, even though there were options like Biracial and Multiracial.
There were 67 unique combinations for the question about Ethnicity.
My approach was to simplify the information for the solely purpose of getting a better idea about ethnicities.
I kept only the first answer of each respondant.
Then I got the percentages of distinct ethnicities for women developers employed at the time of the survey.
| Ethnicity | % of women |
|---|---|
| White or of European descent | 67.21 |
| South Asian | 8.31 |
| East Asian | 7.09 |
| Hispanic or Latino/Latina | 6.44 |
| Black or of African descent | 4.71 |
| Middle Eastern | 3.89 |
| Multiracial | 0.82 |
| Biracial | 0.82 |
| Native American, Pacific Islander, or Indigenous Australian | 0.66 |
The 4344 actively working women developers that participated in the survey, gave information about their education and ethnicity were predominantly White or of European descents (67.2%), South Asian (8.3%), East Asian (7.1%), Hispanic or Latino/Latina (6.4%), and Black or of African descents (4.7%). 504 didn’t provide information.
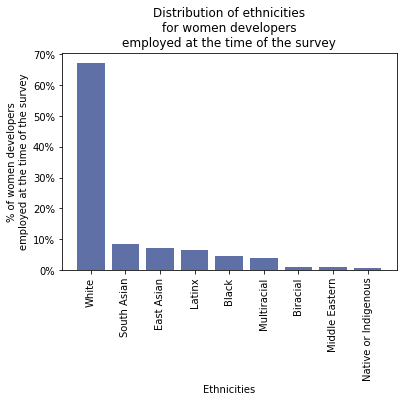
The plot give us an idea of the ethnicities of the participants.
But ethnicity makes sense in a context of where the participant is located.
| Country | Black or of African descent | East Asian | Hispanic or Latino/Latina | Middle Eastern | Multiracial | Native American, Pacific Islander, or Indigenous Australian | South Asian | White or of European descent |
|---|---|---|---|---|---|---|---|---|
| Australia | 0.00 | 15.90 | 2.27 | 3.40 | 0.00 | 2.27 | 3.40 | 71.59 |
| Brazil | 13.04 | 4.34 | 40.57 | 0.00 | 4.34 | 1.44 | 0.00 | 31.88 |
| Canada | 2.31 | 10.64 | 5.55 | 2.31 | 2.31 | 1.38 | 6.94 | 66.20 |
| France | 8.33 | 4.76 | 2.38 | 2.38 | 2.38 | 0.00 | 1.19 | 75.00 |
| Germany | 1.36 | 3.19 | 2.73 | 3.19 | 0.45 | 0.00 | 4.10 | 83.10 |
| India | 0.48 | 11.65 | 0.00 | 0.97 | 0.48 | 0.48 | 85.92 | 0.00 |
| Netherlands | 2.66 | 1.33 | 6.66 | 2.66 | 1.33 | 0.00 | 5.33 | 80.00 |
| Poland | 0.00 | 0.00 | 0.00 | 1.12 | 0.00 | 0.00 | 0.00 | 98.87 |
| United Kingdom | 4.94 | 1.74 | 1.16 | 1.74 | 2.03 | 0.29 | 3.48 | 83.72 |
| United States | 5.97 | 8.49 | 5.78 | 1.29 | 0.55 | 0.98 | 3.94 | 72.29 |
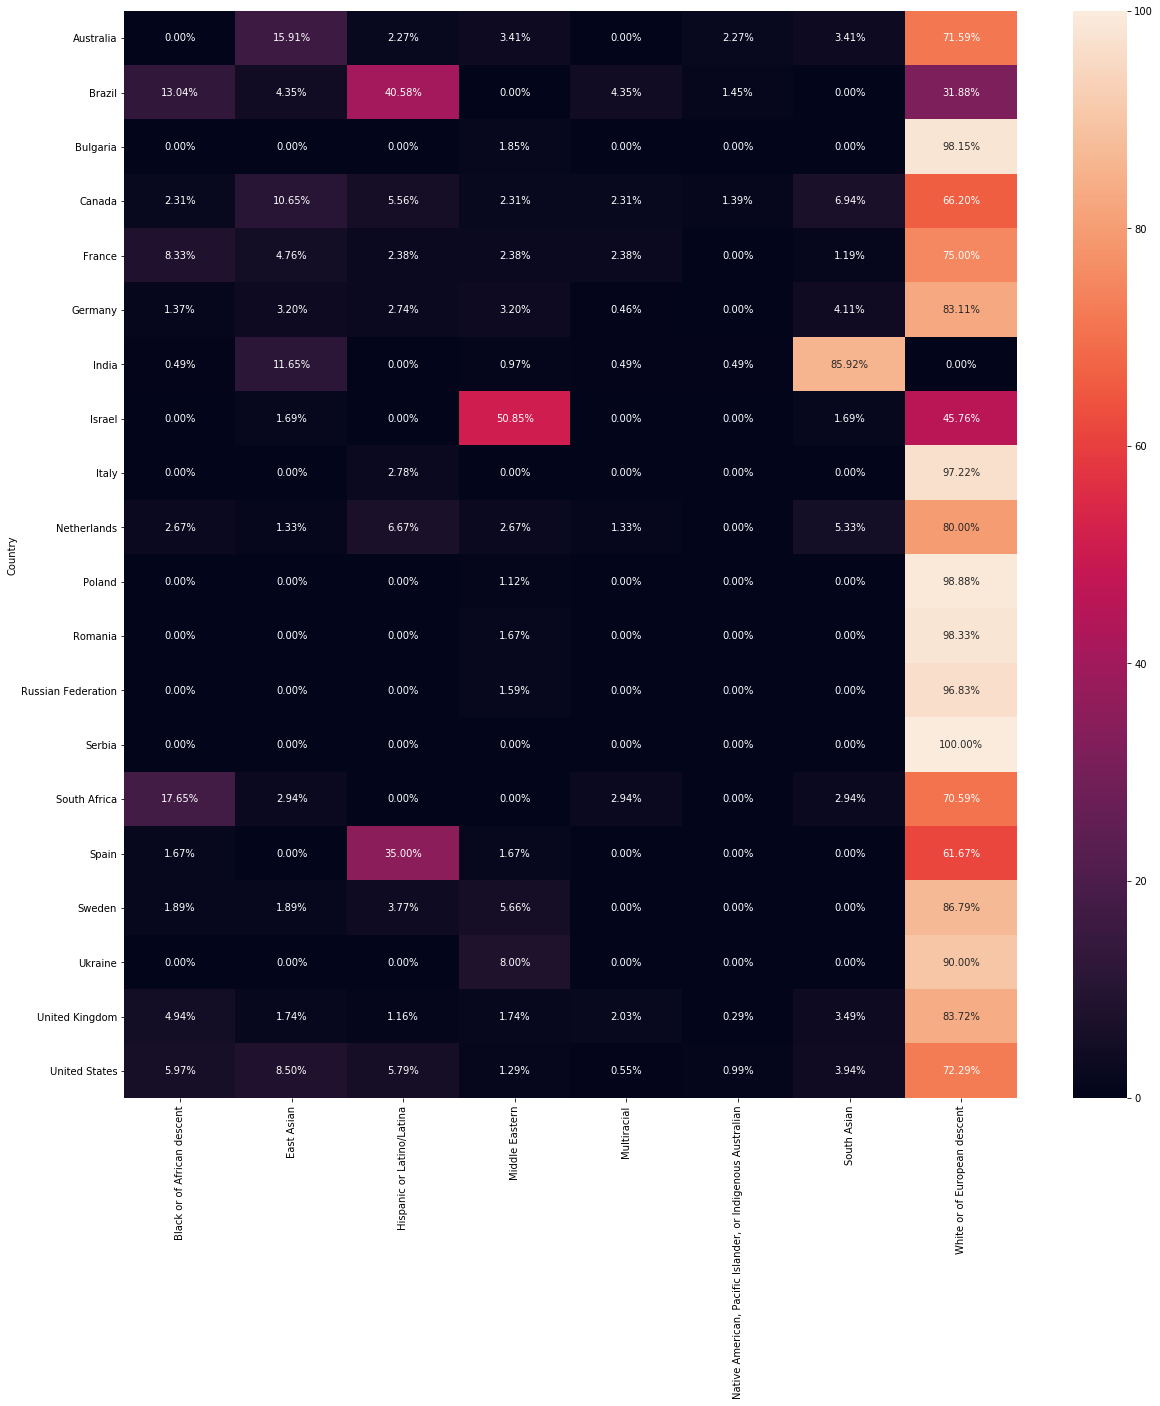
As we can see in the heatmap, each country was paired with the percentage of women developers currently located there and their ethnicity.
Women vs. Stack Overflow
I also wanted to know if there was any relation between years elapsed since they started to work as a professional developers and the first time they visited SO, and how frequently they visit the site.
| Years of Work Experience since/before 1st visit to SO | Multiple times per day | Daily or almost daily | A few times per week | A few times per month or weekly | Less than once per month or monthly | I have never participated in Q&A on Stack Overflow |
|---|---|---|---|---|---|---|
| 12+ before SO | 1.86 | 5.60 | 4.67 | 14.95 | 44.85 | 28.03 |
| 1 to 12 before SO | 2.99 | 2.72 | 7.90 | 18.52 | 41.41 | 26.43 |
| 1st Job - SO same time | 5.52 | 2.51 | 5.02 | 14.07 | 39.19 | 33.66 |
| 0 to 3 after SO | 2.74 | 3.90 | 6.80 | 14.90 | 37.33 | 34.29 |
| 3 to 5 after SO | 2.90 | 2.61 | 4.65 | 14.24 | 42.44 | 33.13 |
| 5+ after SO | 2.32 | 2.32 | 10.07 | 10.85 | 40.31 | 34.10 |
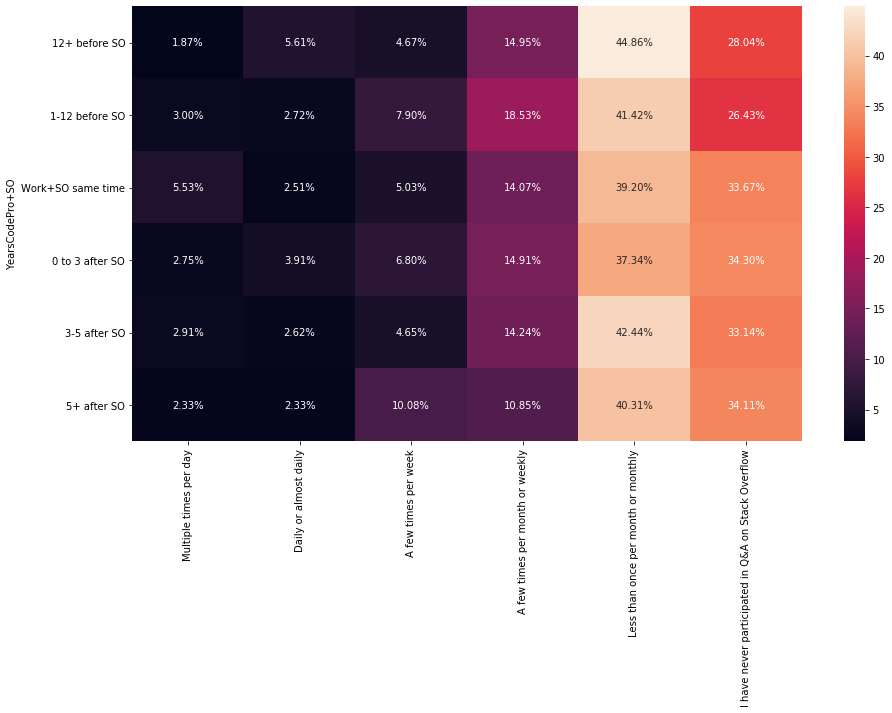
When asked how frequent was their participation in Stack Overflow, whether they were professionals with more than 12 years of work experience before visiting SO for the first time, visited SO for the first time around the same time they started to work as developers, or first visited SO more than 5 years before started to work as developers, the majority agreed that they visited the site less than once per month or monthly. The second most chosen option was that they never participated in a Q&A.
Age vs. Social Media
Out of my curiosity I wondered where could I find women developers to connect with them. I’ve found many on Twitter (say hi!).
When asked what social media site they used the most,
| Age Range | None | Snapchat | VK | YouTube | |||||||
|---|---|---|---|---|---|---|---|---|---|---|---|
| <18 | 11.11 | 0.00 | 0.00 | 27.77 | 0.00 | 16.66 | 0.00 | 0.00 | 0.00 | 5.55 | 38.88 |
| 18-25 | 19.15 | 3.33 | 2.49 | 12.90 | 1.24 | 12.57 | 0.99 | 0.99 | 0.16 | 15.73 | 12.73 |
| 25-32 | 20.92 | 3.92 | 2.36 | 12.10 | 0.75 | 17.59 | 0.53 | 0.53 | 0.00 | 14.95 | 8.33 |
| 32-39 | 12.24 | 4.61 | 3.89 | 8.35 | 0.00 | 24.63 | 0.57 | 0.57 | 0.00 | 12.39 | 7.63 |
| 39-46 | 6.95 | 6.95 | 4.39 | 4.02 | 0.00 | 34.06 | 0.36 | 0.00 | 0.36 | 9.89 | 5.12 |
| 46-53 | 4.96 | 5.67 | 5.67 | 3.54 | 0.00 | 31.20 | 0.00 | 0.00 | 0.00 | 6.38 | 6.38 |
| 53+ | 1.75 | 8.77 | 12.28 | 3.50 | 0.00 | 29.82 | 0.00 | 0.00 | 0.00 | 14.03 | 3.50 |
Even though it is informative on its own, it doesn’t say much since I have to search back and forth to get the maximum values.
Next, I found useful to visualize the matrix of values with a heatmap as done with Ethnicity.
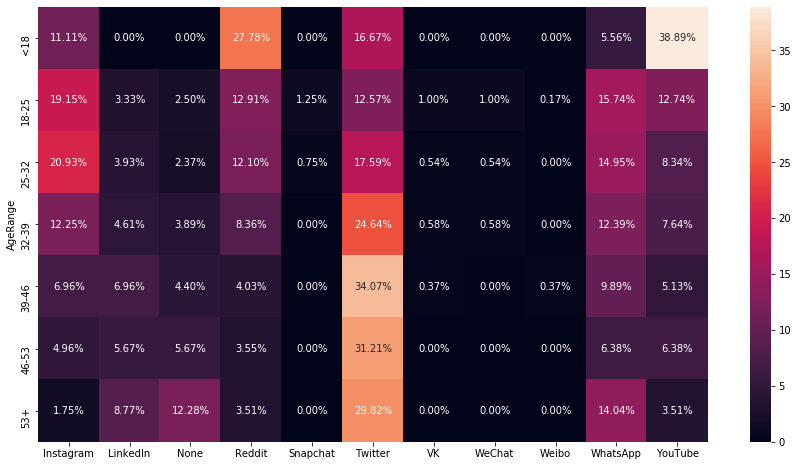
From 4848 women developers, actively working at the time of the survey, 626 opted-out to disclose their age and/or social media site of preference, and 4243 provided both.
I found that Twitter was the site of preference for women older than 32 years old, Instagram for women older than 18 and younger than 32 years old, and YouTube was the choice for women younger than 18 years old.
Summary
Based on the results we got:
- 7.4% of the participants identified themselves as women,
- 85.7% of them had a full/part-time job or was independent contractor, freelancer, or self-employed,
- 78% was developer by profession and 11.8% was not primarily a developer, but wrote code as part of their job,
- 54.36% had a Bachelor’s degree, 27.20% has a Master’s degree, and 7.64% has some college or university studies but didn’t earn a degree,
- 34.8% were from United States, 8.6% from India, 7.3% from UK, 4.8% from Canada, and 4.7% from Germany, other countries had much less representation,
- 67.21% were White or European descent, 15.4% Asian, 6.44% Hispanic or Latina, 4.71% Black or of African descent, other categories had much less representation (Middle Eastern, Native American, Pacific Islander, or Indigenous Australian),
- they visited the site less than once per month or monthly, or never participated in a Q&A,
- as of social media sites, Twitter was the choice of women older than 32 years old, Instagram for women older than 18 and younger than 32 years old, and YouTube was the choice for women younger than 18 years old.
I limited my analysis to a few questions, but there’s only so much more we can do with this dataset.
I hope you find it informative, and feel free to comment/suggest, correct if you spot any errors.
Thanks for reading!